Improved
Introducing Analytics Improvements
about 2 months ago by Gleb Mendrul
📖 Introducing the New Analytics Dashboard
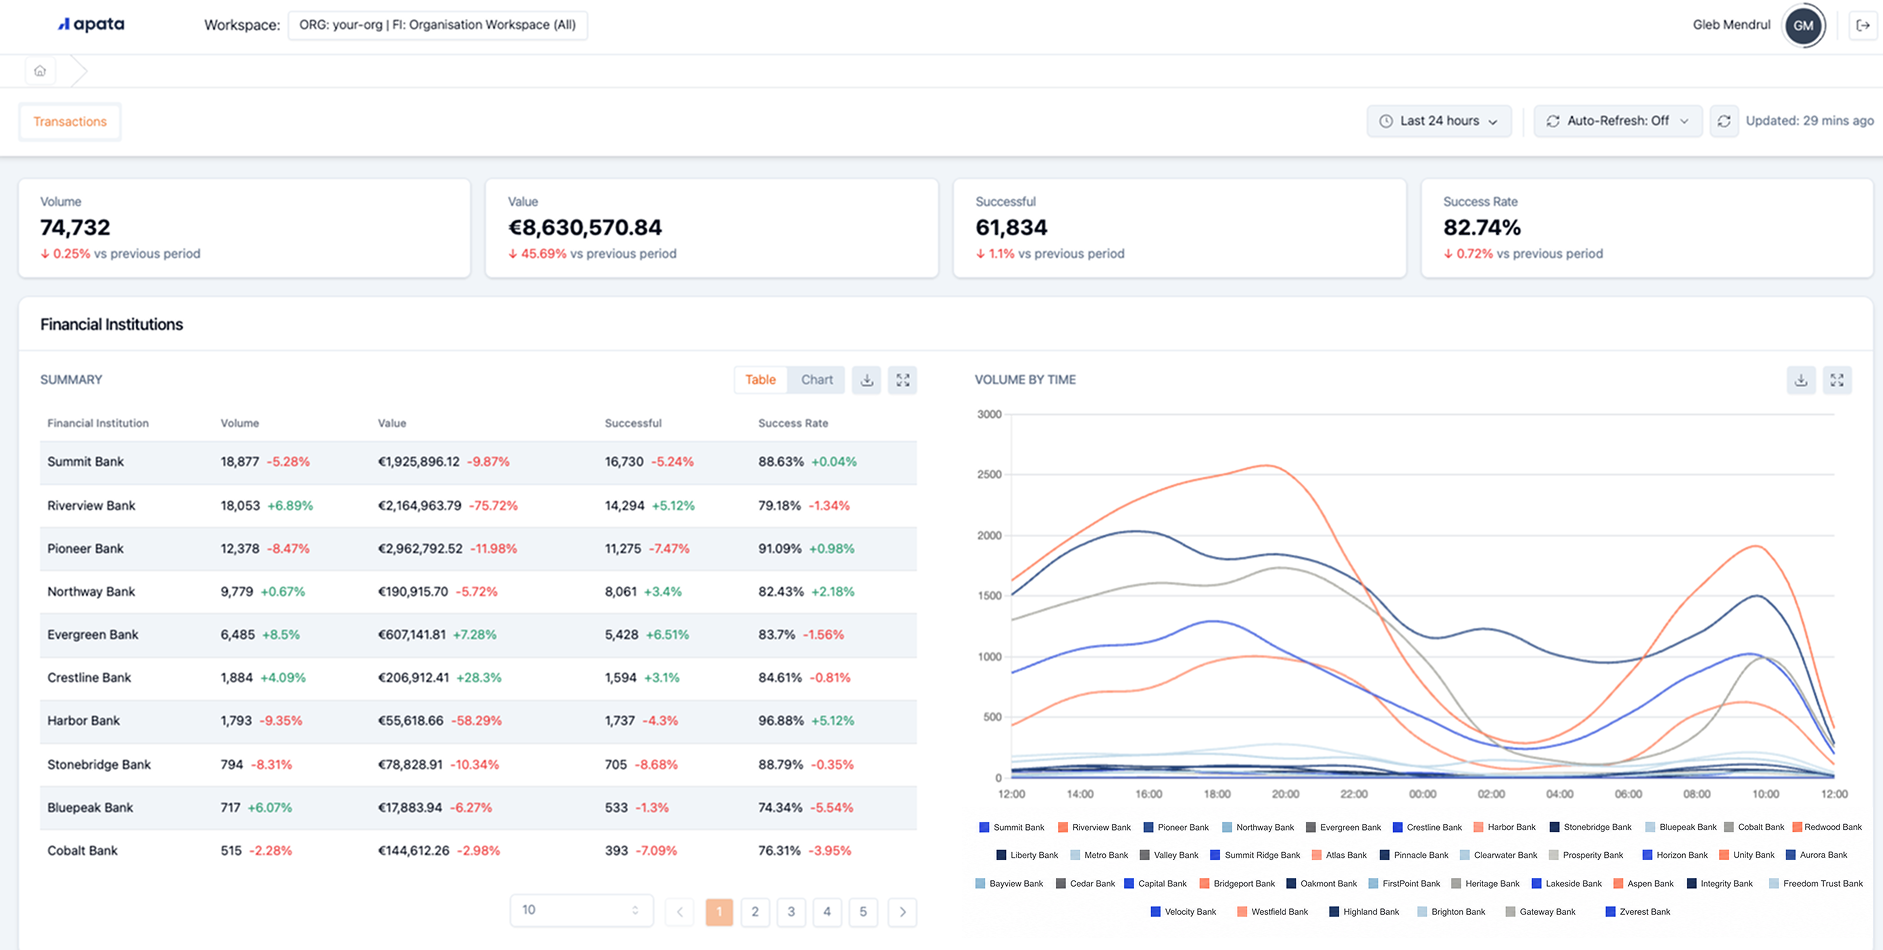
Your system health, at a glance. Apata's dashboard now gives you powerful monitoring and performance insights - right at your fingertips. 🎉
Spot issues before they escalate, dig into transaction trends, and prove performance to your clients - all from one unified view. Whether you're managing platform-wide health or a single client's card program, the new analytics tools help you stay ahead. 💪
⚙️ What's New
- Flexible Time Periods - Select custom date ranges to view performance exactly how you need it. Compare day-over-day, week-over-week, or zoom into a specific incident window. No more fixed reporting intervals. ✅
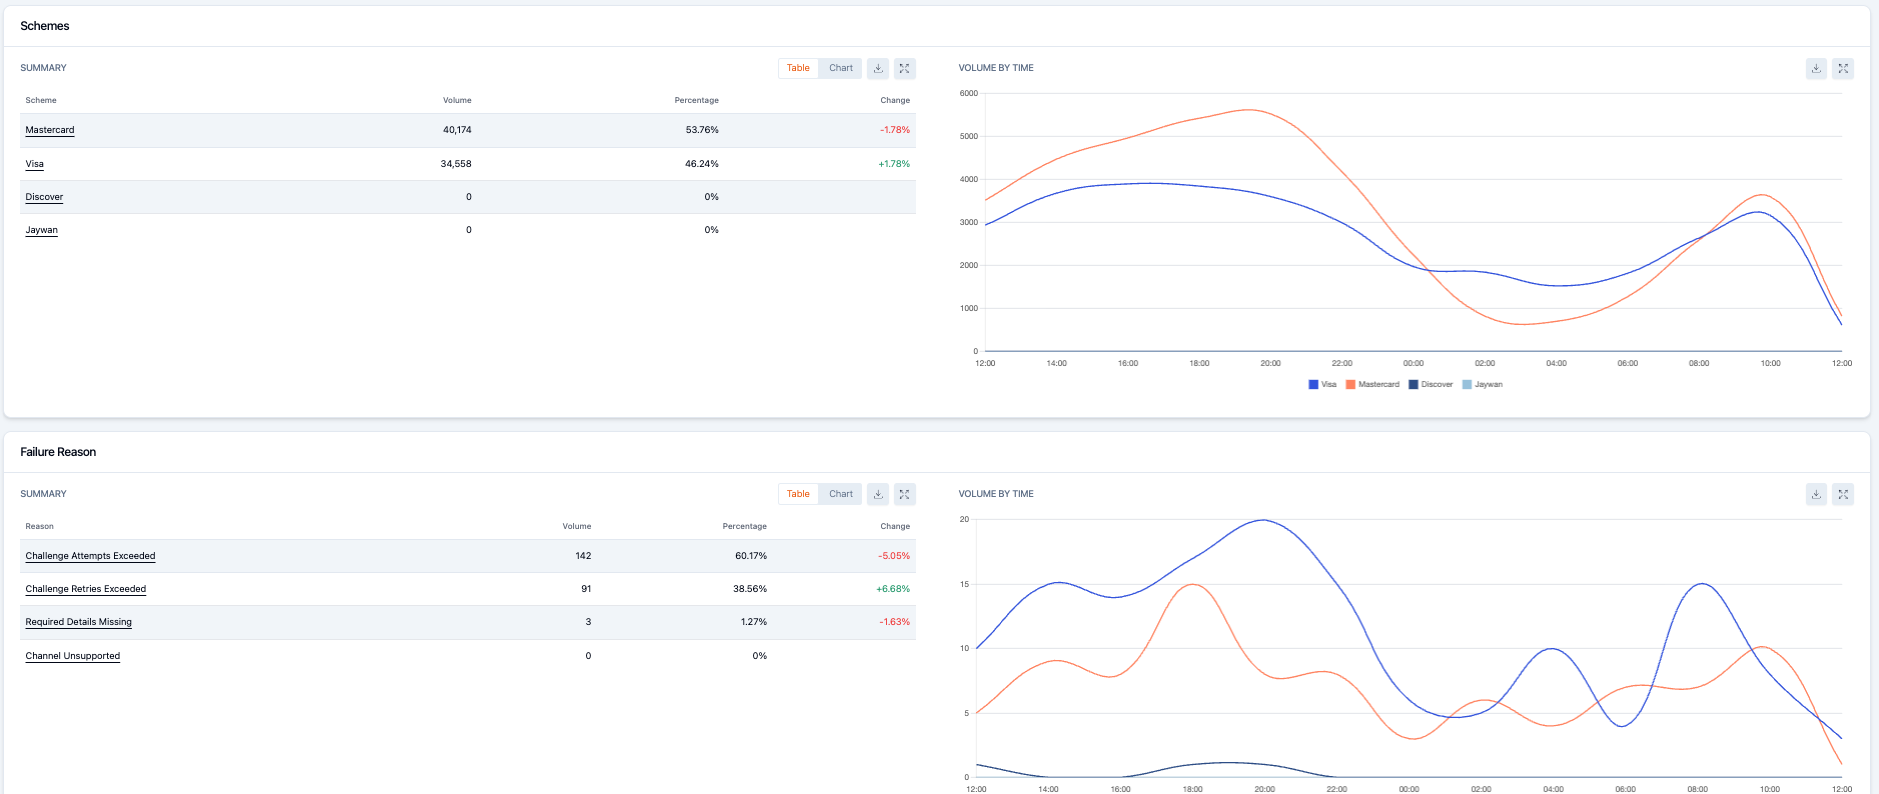
- Deeper Transaction Data - Drill into individual transactions to understand what's happening beneath the surface. See breakdowns of key 3DS metrics including challenge rates, frictionless approvals, and authentication outcomes.
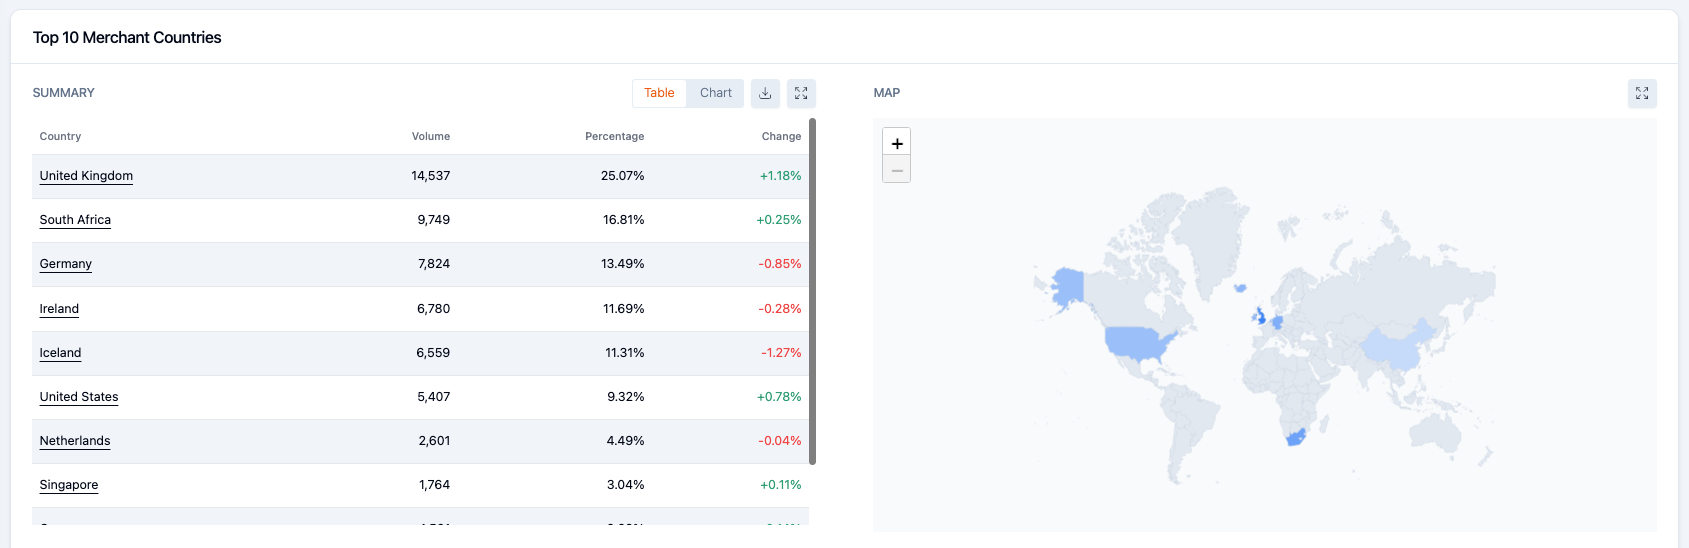
- Top Merchants & Countries - Instantly see where your traffic is coming from. Identify your highest-volume merchants and geographic hotspots without exporting a single report.
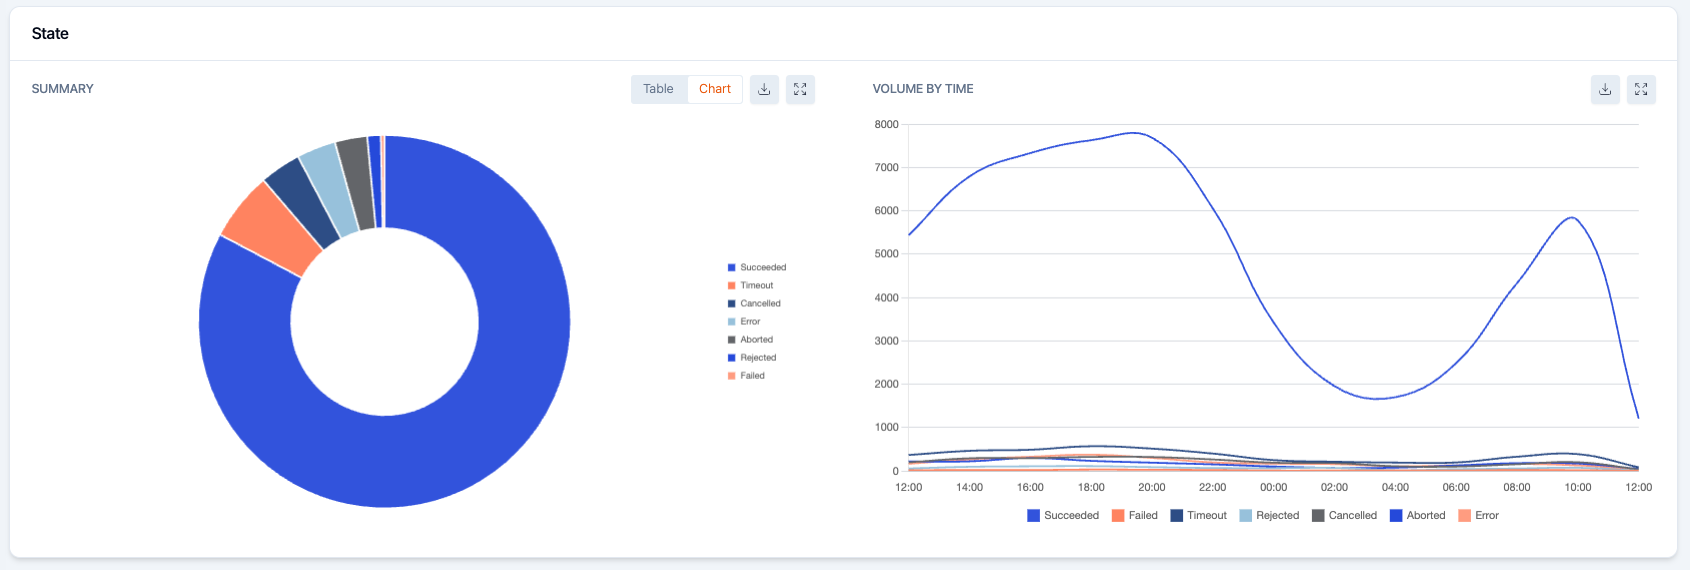
- Trends & Spike Detection - Visualise transaction volumes and success rates over time. Spot anomalies and patterns as they emerge - not after the fact.
📌 Built for Two Workflows
Platform operators get a bird's-eye view across all clients - spot patterns, confirm system health, and diagnose root causes quickly. Client managers get a focused, single-program view - configure settings, track performance, and share compliance-ready metrics with confidence.
🚀 Quick Access to More Data
- All key metrics are surfaced on a single screen - no need to check each data point individually
- Breakdowns of authentication outcomes, challenge rates, and exemption usage are available in one click
- Filter by client, program, scheme, or time period to get exactly the view you need