
Introducing Integrations and Third Parties Analytics
📖 Two New Tabs, Complete Visibility
Know exactly what's flowing through your integration. We've expanded the analytics dashboard with two powerful new views: Integrations and Third Parties. 🎉
We've been busy expanding our analytics capabilities, and today we're excited to share two powerful new additions to the dashboard: the Integrations tab and the Third Parties tab.
These new views give you complete visibility into how data flows between your systems and Apata, as well as how our platform communicates with external services on your behalf. 💪
⚙️ Integrations Tab
The Integrations tab puts all your Apata connection data in one place. No more guessing whether requests are getting through or piecing together information from multiple sources.
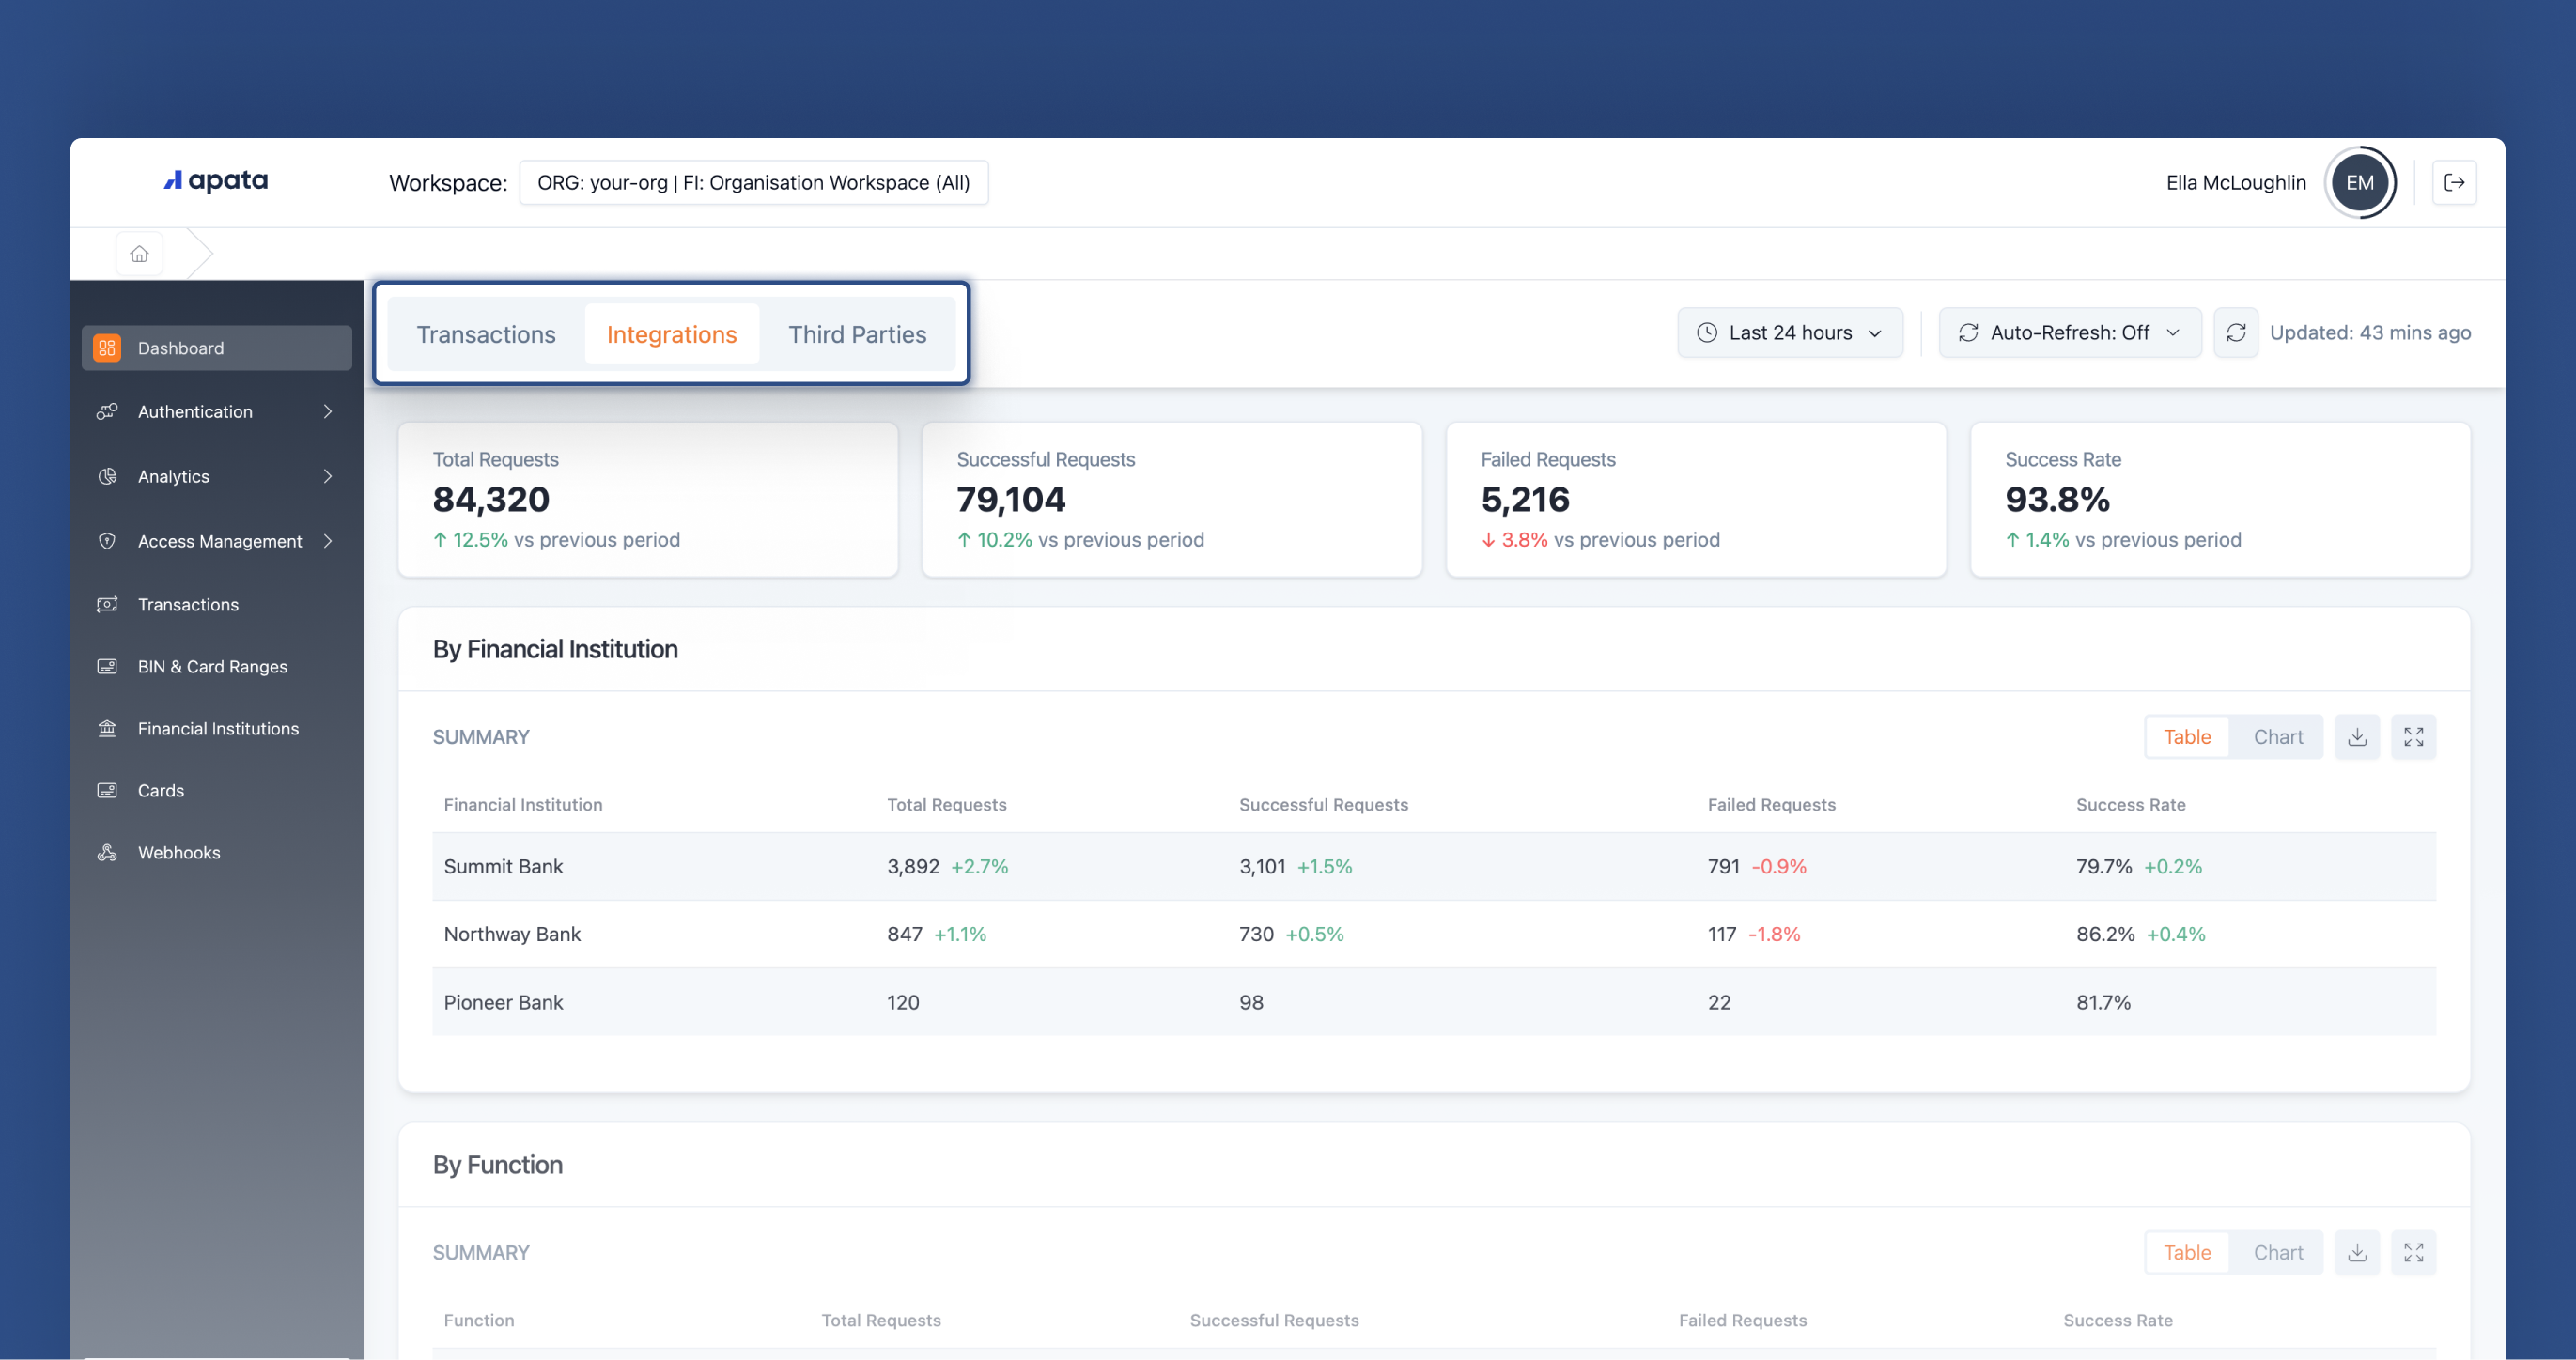
Here's what you'll find:
-
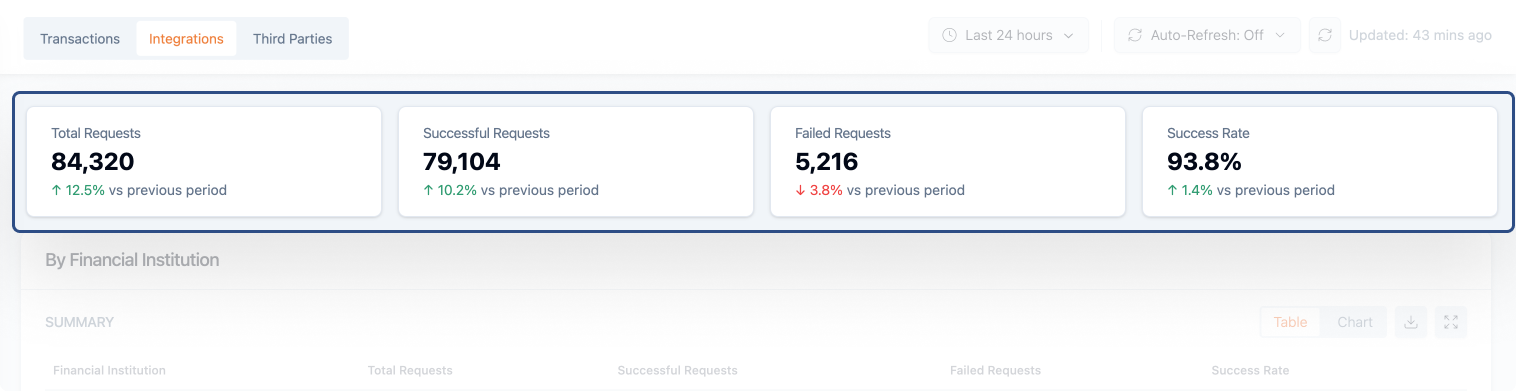
Request Overview - At a glance, see your total HTTP requests for any given period, alongside the number of successful and failed requests. The success rate is calculated automatically, so you can quickly assess the health of your integration. ✅
-
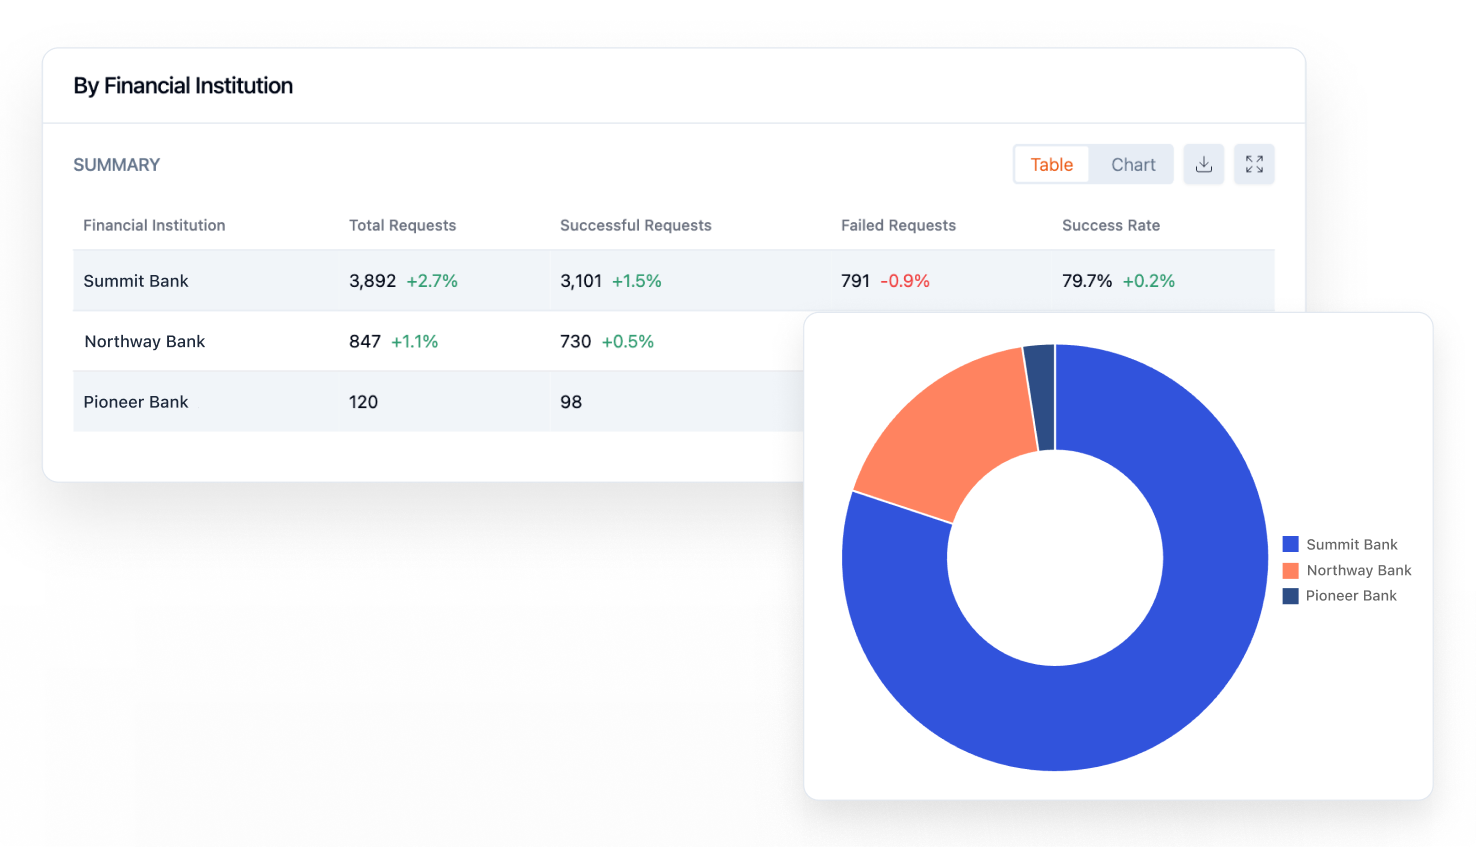
Financial Institution Breakdown - Drill down into request volumes by Financial Institution. This is particularly useful when troubleshooting or when you need to understand traffic patterns across different banking partners.
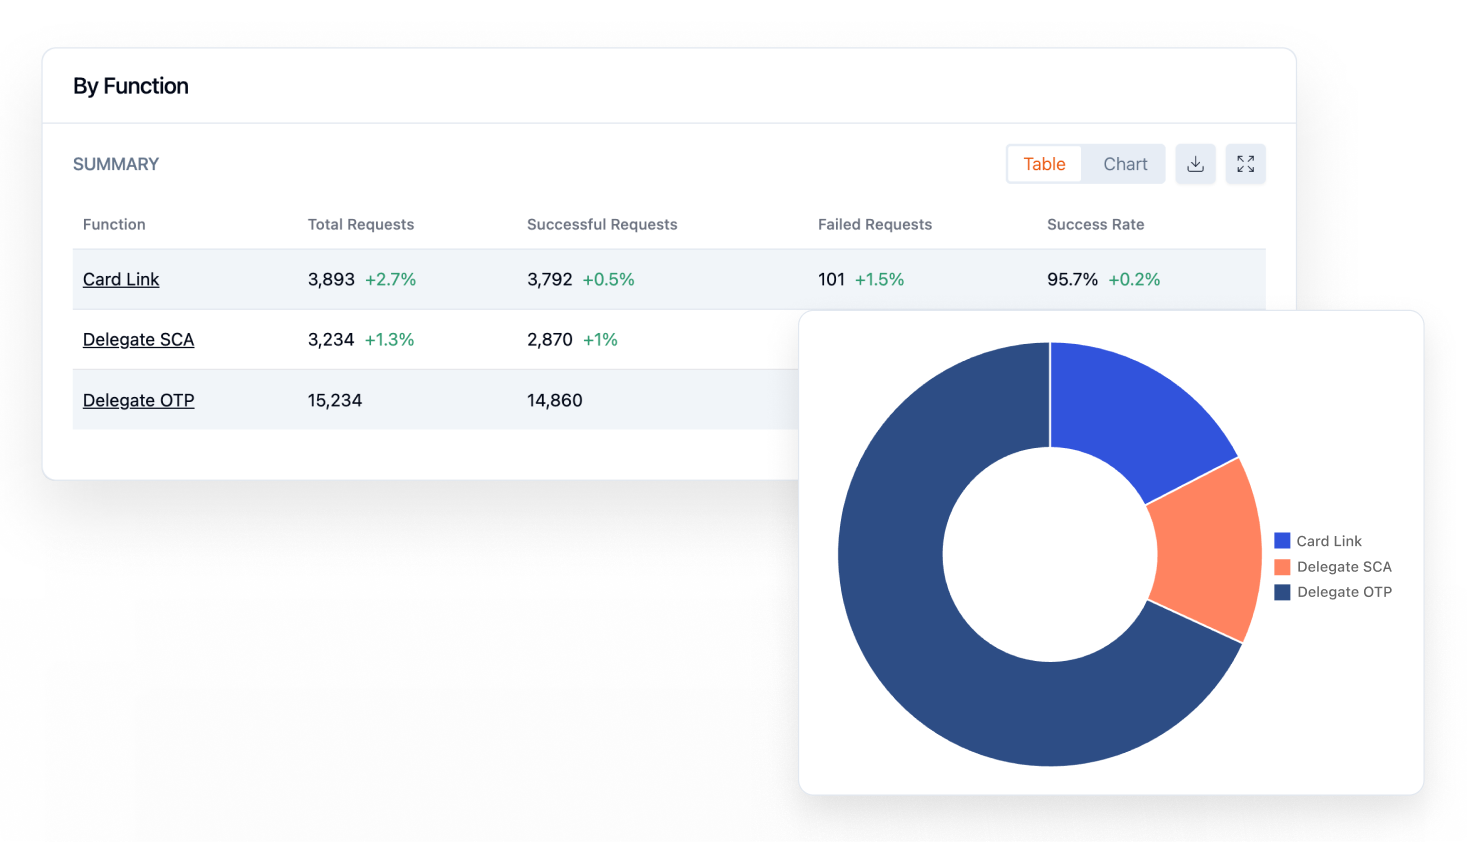
- Function Breakdown - See how requests are distributed across different functions: Card Link, OOB (Out-of-Band), and Finalised Event. Understand which parts of the integration are seeing the most activity.
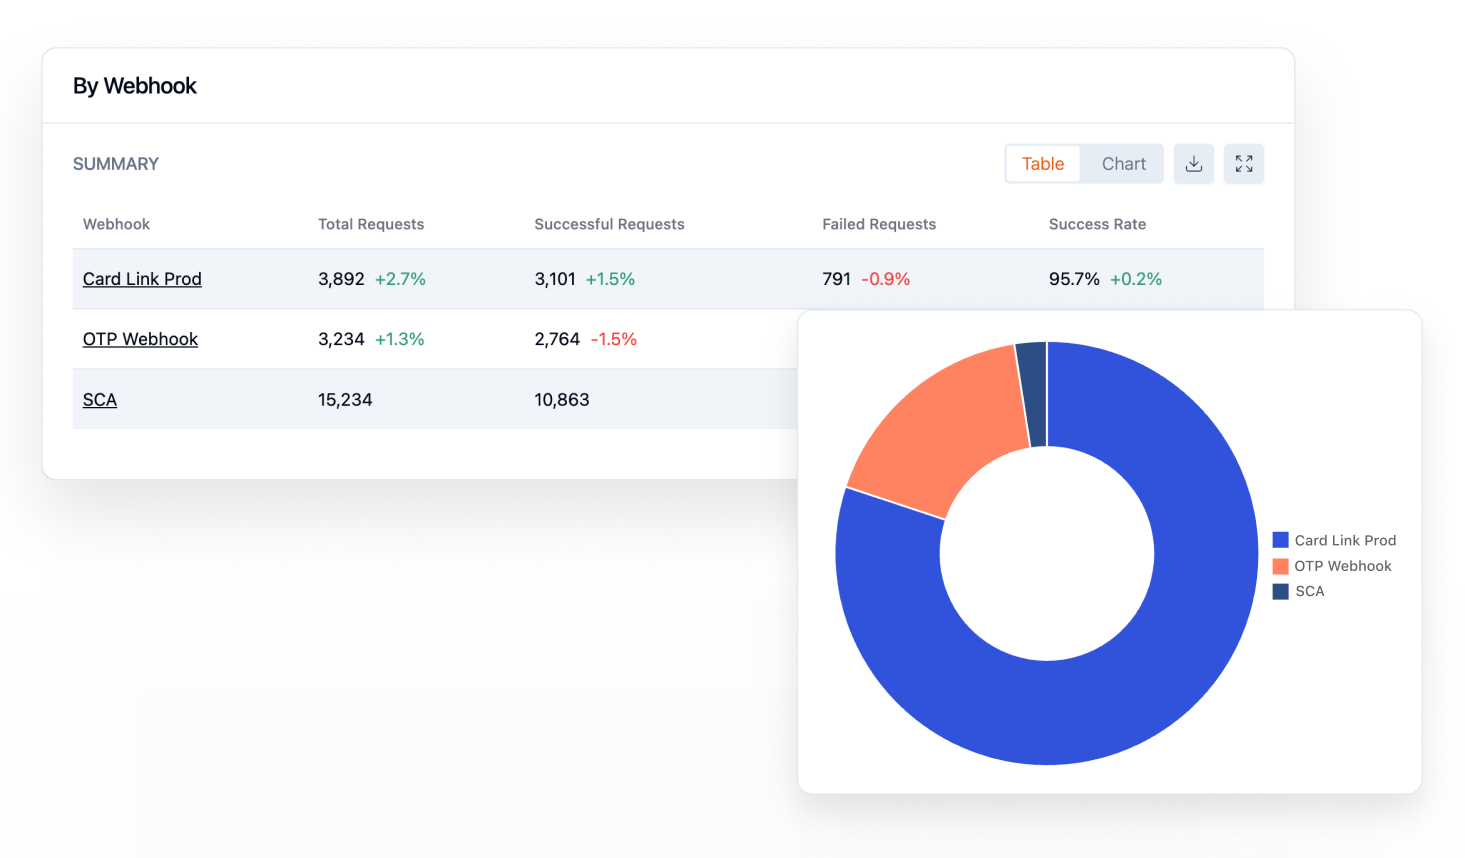
- Webhook Analytics - Get a clear view of webhook delivery performance. Understand how many webhooks are being sent, received, and whether any are failing to reach their destination.
🔗 Third Parties Tab
The Third Parties tab shines a light on how Apata communicates with external services like payment schemes, Twilio, and other providers that power parts of your programme.
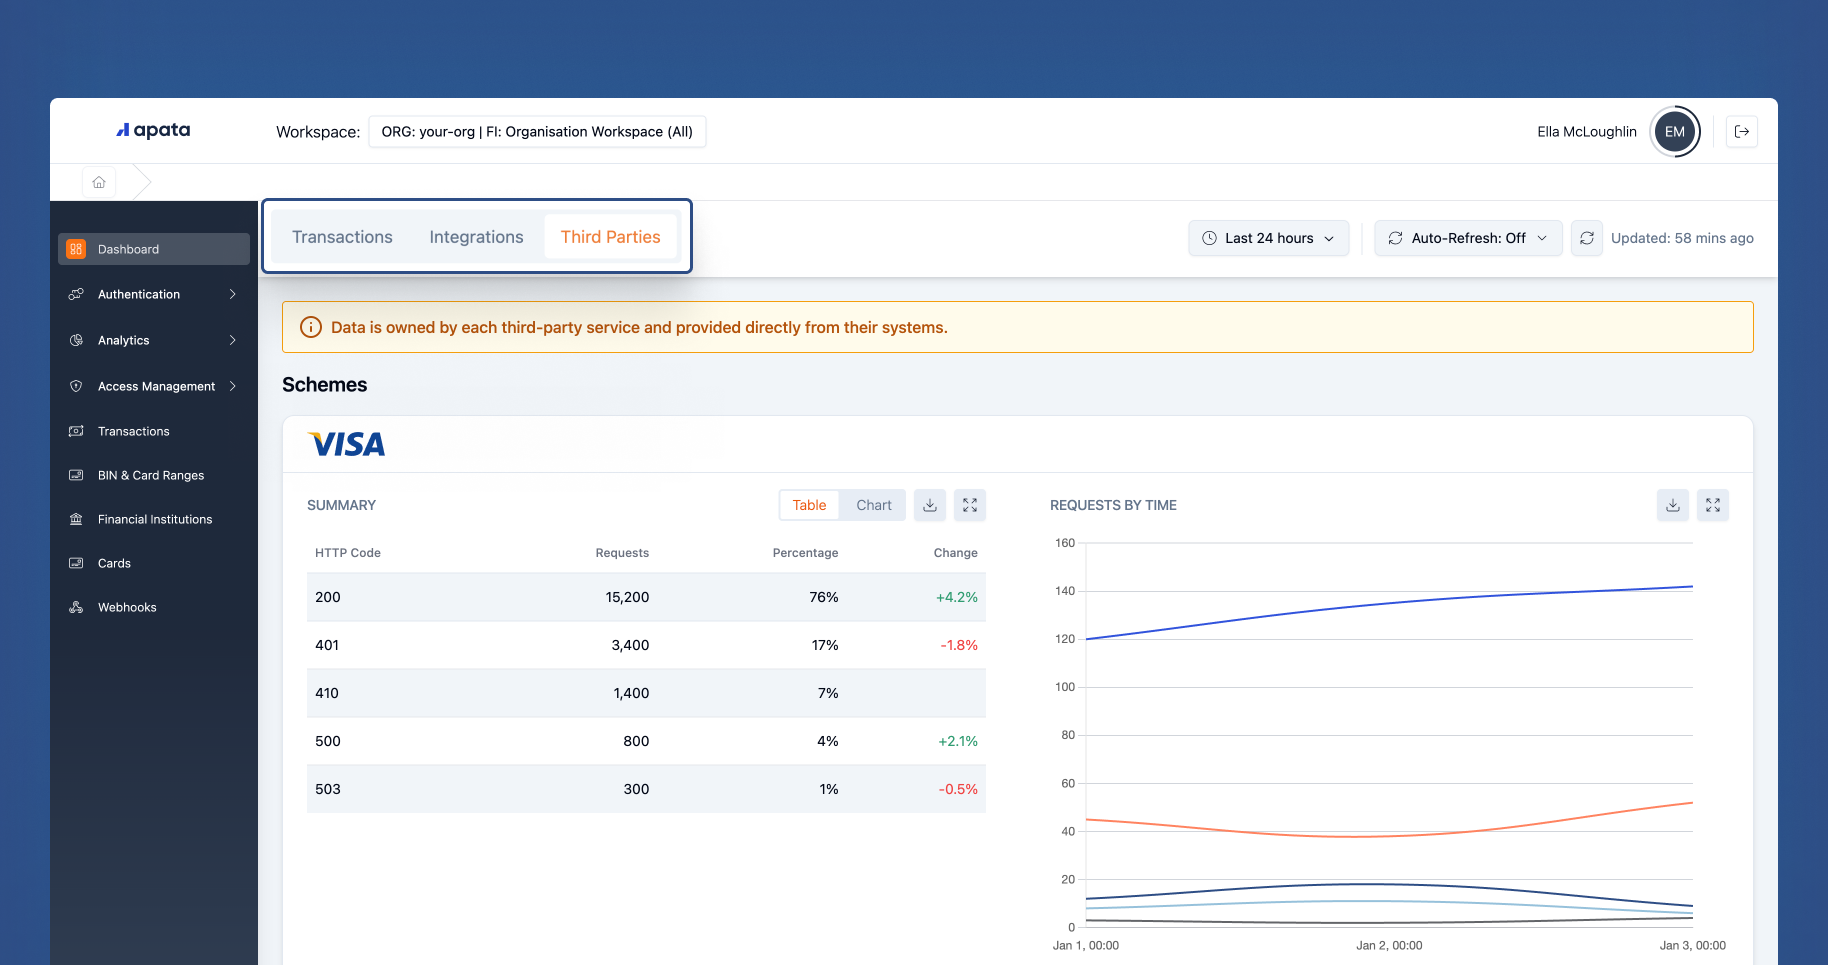
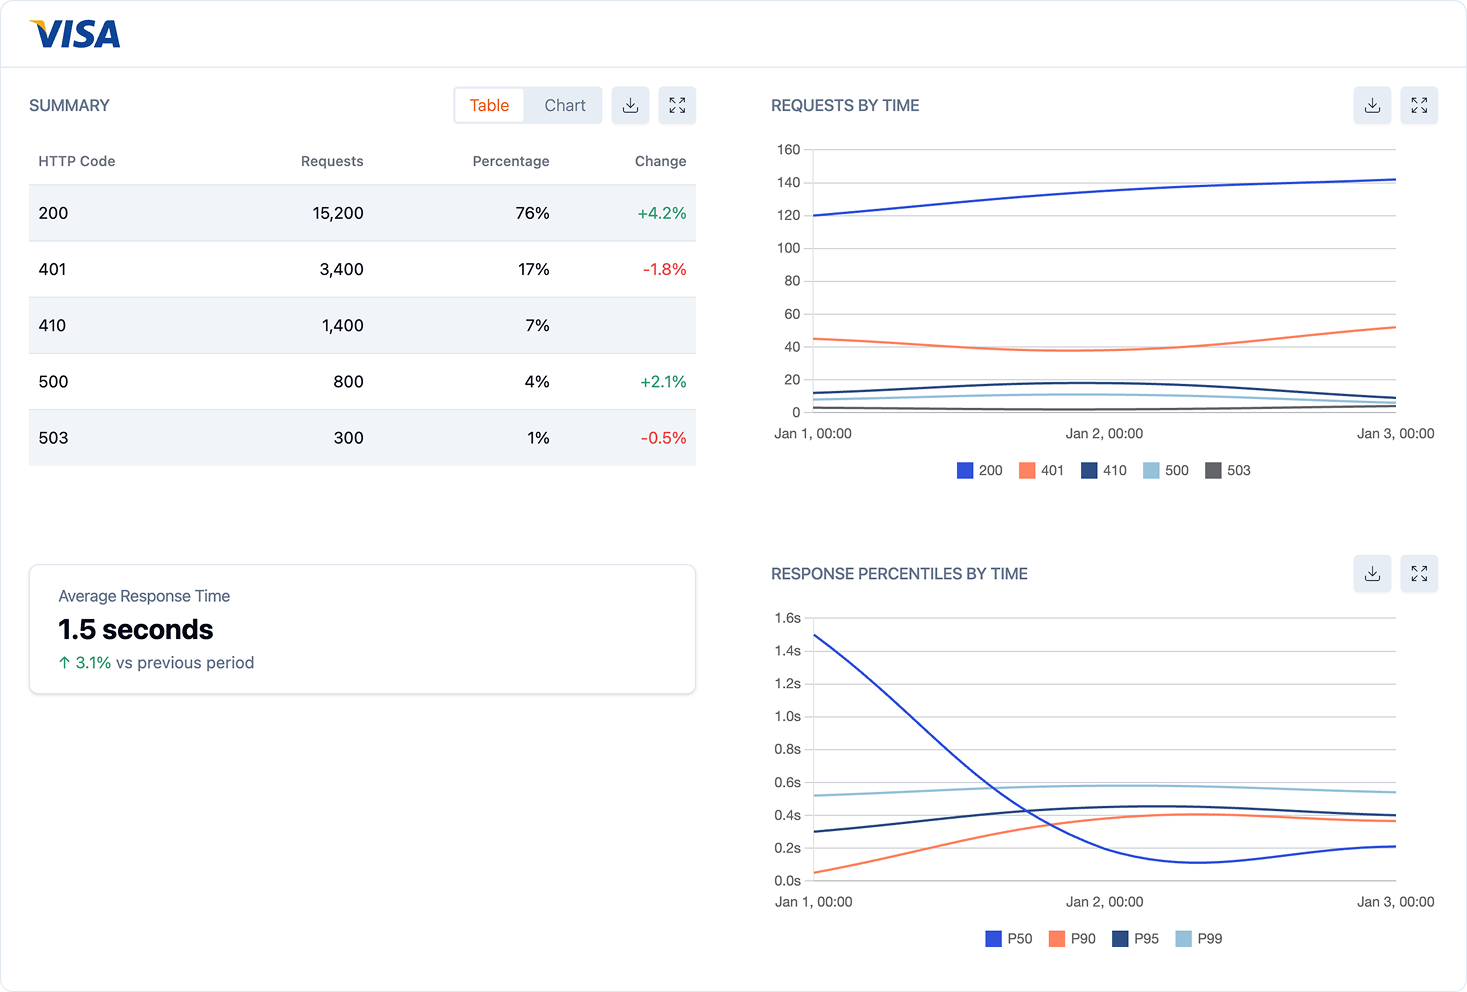
For each third-party service, you'll see:
- Total requests sent to the service ✅
- Successful and failed requests with clear visual indicators
- Average response time so you can spot any latency concerns
- Response time percentiles for a more nuanced view of performance
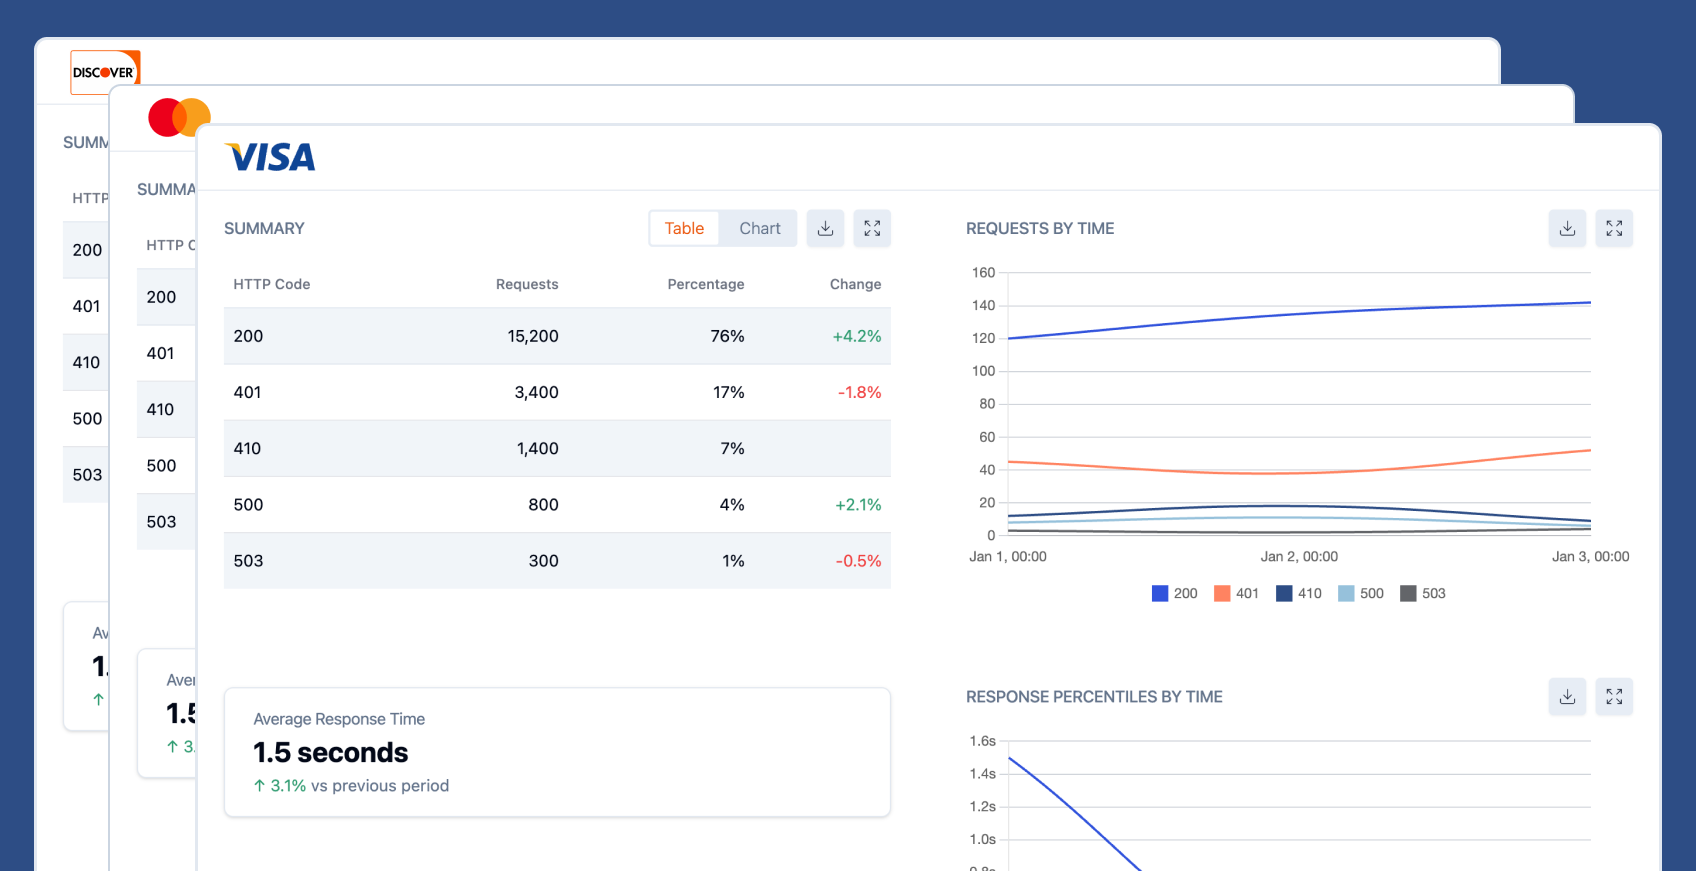
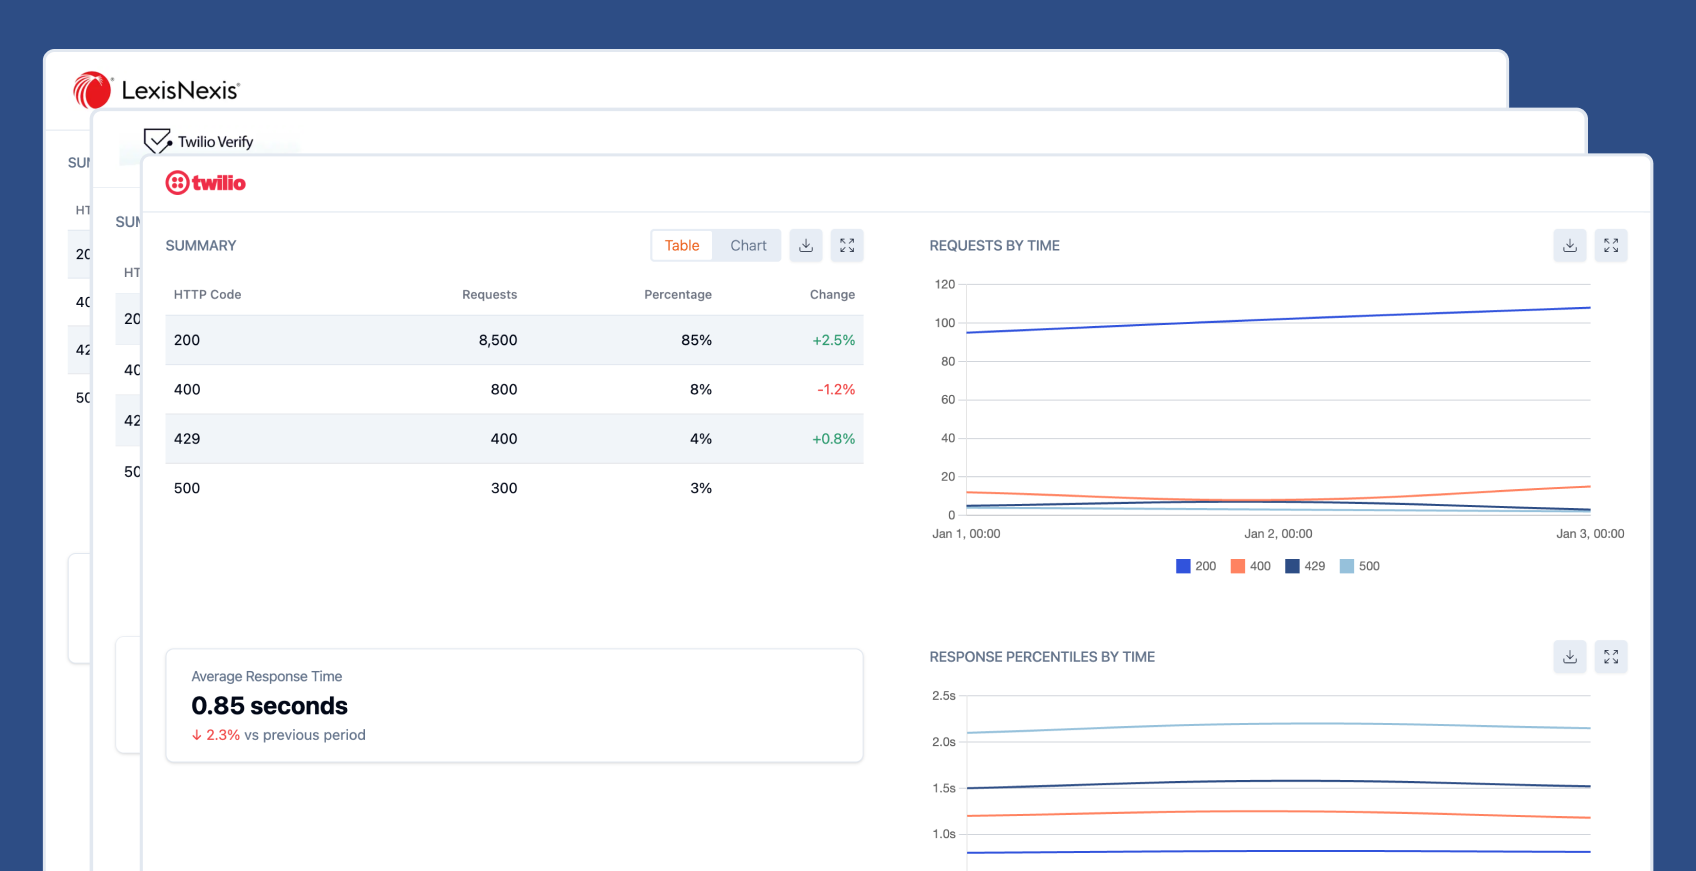
This level of detail is invaluable when diagnosing issues. If something feels slow, you can quickly identify whether the bottleneck is on Apata's side or with an external provider.
🚀 Why This Matters
Platform operators can now track every request flowing in and out of Apata. Client managers can confidently report on integration health and quickly diagnose any issues.
Together, these tabs give you end-to-end visibility into your integration's performance. Whether you're investigating a support ticket, preparing for a business review, or simply keeping an eye on system health, everything you need is now just a click away. 🙌
As always, we'd love to hear your feedback. Let us know how you're using these new analytics features!
Reach out to your account manager to get started. Not a customer? Speak to an expert to find out more - Link